Ease Monitor
- 1. Product Principles
- 2. Design Principles
- 3. Architecture
- 4. Prerequisite and Limitation
- 5. Features Showcase
- 6. Technical Details
1. Product Principles
The Ease Monitor is designed by the following principles:
Focus on the SLA. Monitoring the API which consumed by end-user.
Metrics Aggregation. Connecting the infrastructure and middleware metrics with application.
Quick Fault Location. The failure always happens, quickly address and recovery the fault is the key.
In other words, the Ease Monitor is designed for two major scenarios:
Health Checking.
Capacity Management. By comparing the data trend, it can help engineering team decides whether add more resource.
Performance Management. Managing the application stack performance, make sure every pieces of stack works fine on production.
Diagnosis.
Locating the Failure. Once the failure or exception happens, it helps developer find the root location of failure quickly.
Performance Analysis. It helps find the software bottle neck and hot spot which developer can dive into the code.
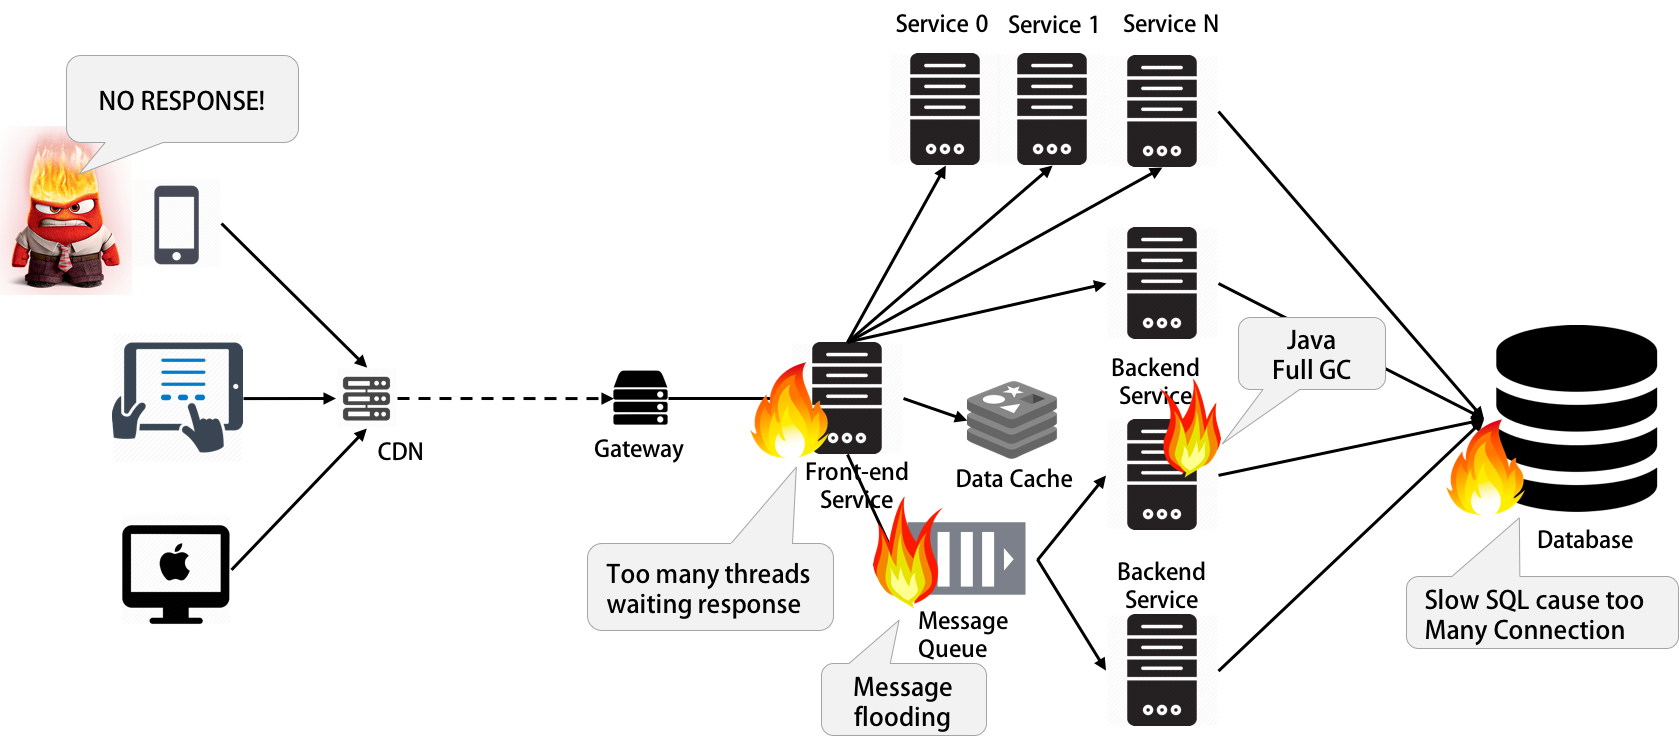
The following is a case usually happens. A slow SQL or Java Full GC could cause the the whole site running very very slow.
2. Design Principles
The Ease Monitor is a kind of APM - Application Performance Management, but it’s a bit different with the traditional APM software.
There are two aspects impacts the design of the Ease Monitor:
Different Engineering Angle. We know, there are several engineers role in a company, and they looking at the whole system from different angles. For example,
- Manager likes the whole system’s health.
- Software Developer likes to know the application’s running status.
- Operation Team likes to know the infrastructure and the middleware’s running status.
No reinvent the wheels. Developing a monitor system looks like reinvent another wheel. So, we won’t want to reinvent everything, and need make use the
Ease Monitoris opening and flexible enough to be compatible with the current mainstream monitoring technologies.
So, the Ease Monitor had the following design principles:
Using Mainstream Technology. Most of engineering teams in this world can operate and maintain it.
Every Components can be Replaced or Tailored. People has different requirement and business, so, the design must give the enough flexibility that anyone can modify it easily.
Tracing the Services Requests. The monitor must trace request crossing the distributed system from end to end.
Guiding the Engineering. The monitor must can guide the engineers at least two things, 1) Easily address the issues, 2) Easily make the engineering decision.
Leverage the Automation. The monitor could connect with other control system to do the automated operations, such as: auto-scaling, auto-scheduling, etc.
The Whole Stack Metrics Monitoring. We must monitoring the three layers softwares:
- Service Layer. The key index of service, such as,
HTTP request,Status code,Throughput,Latency…, etc. - Platform Layer. The key index of a number of middleware, such as,
Nginx,Redis,Tomcat,Kafka,MySQL…, etc. - Infrastructure Layer. The key index of operation system, such as,
CPU,Memory,Disk,Networketc.
- Service Layer. The key index of service, such as,
Customized Dashboard. The dashboard can be configured by everyone who have different interests.
3. Architecture
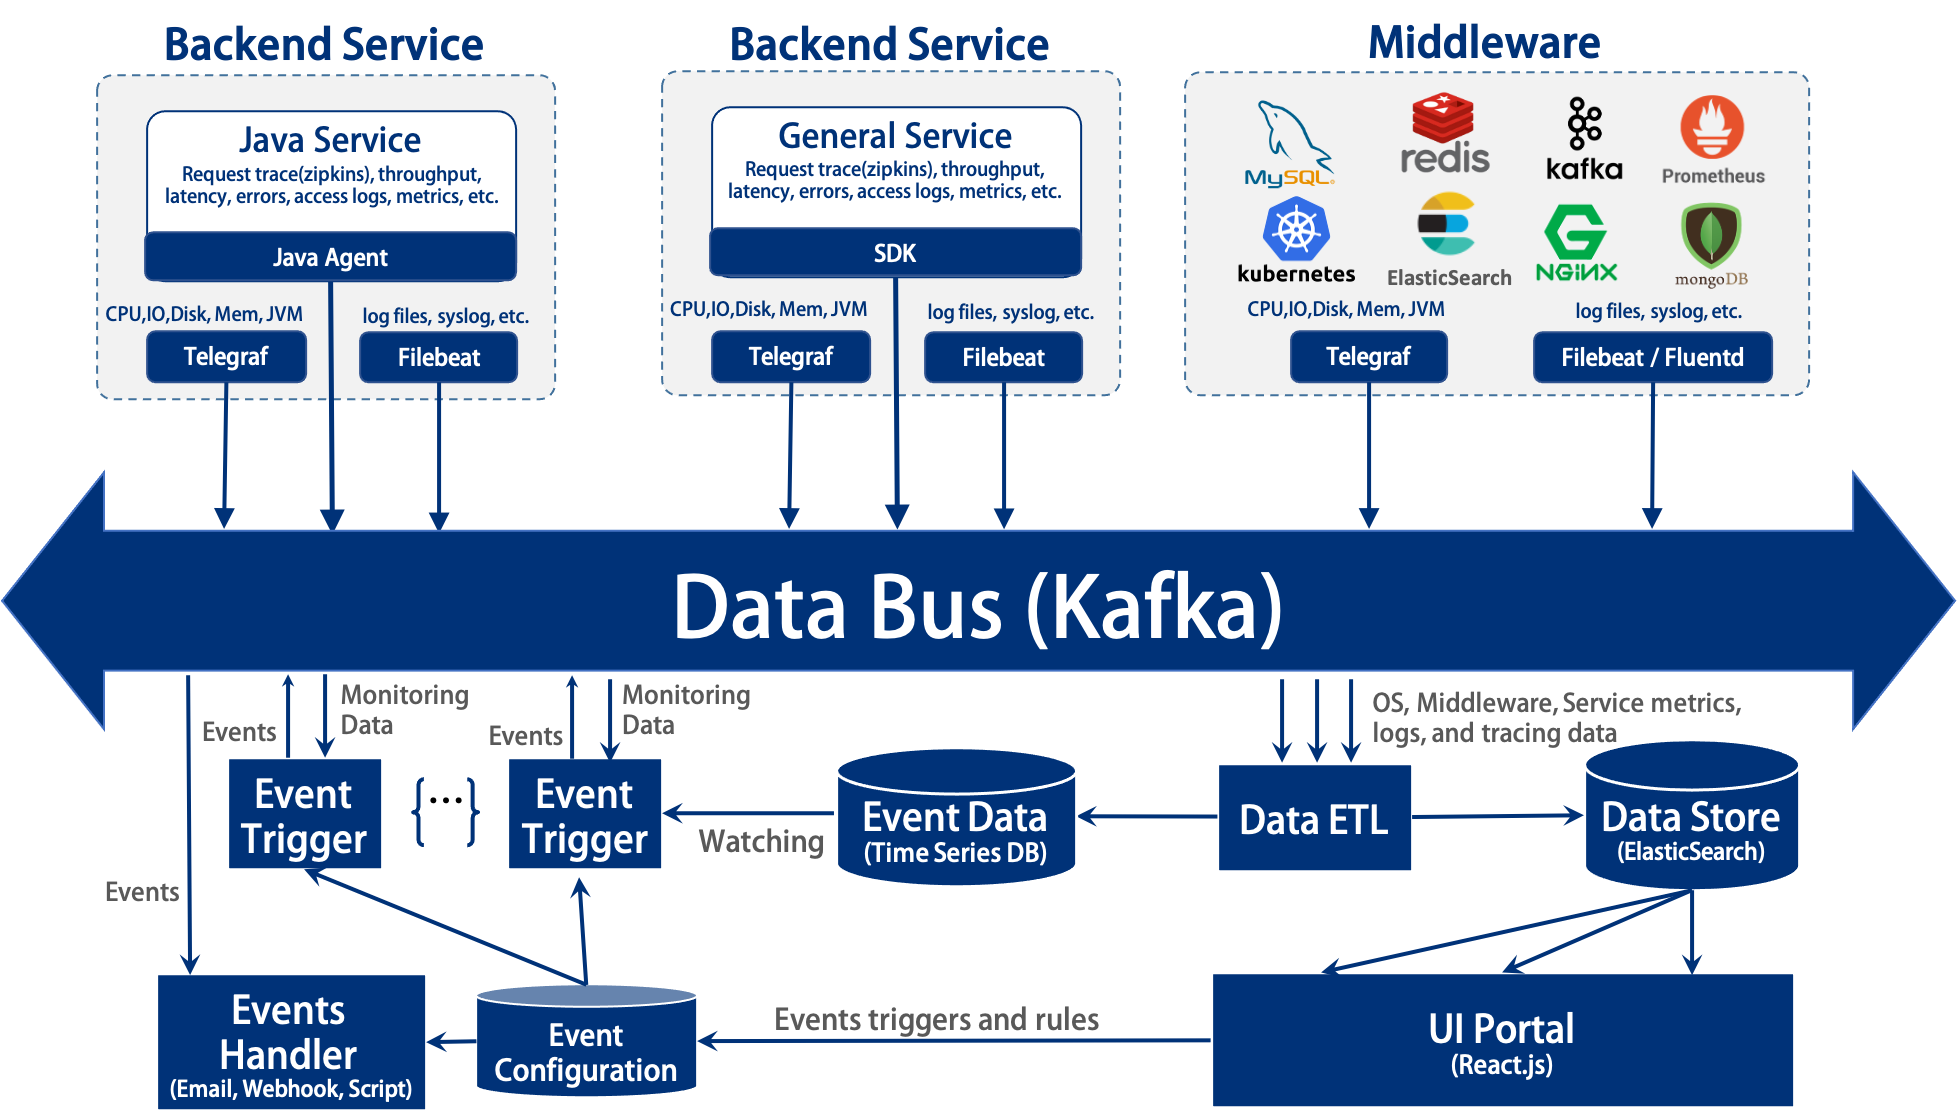
The whole architecture based on the open source technology.
- Agents
- Backend Pipeline
- Data Bus - Apache Kafka
- Data ETL - Logstash
- Data Store - ElasticSearch
- Event Data - InfluxDB
- Event Trigger & Handler - This is developed by us. (See the Technical Details section)
- UI Portal - This is developed by us. (See the Technical Details section)
The whole architecture not only can monitor big clusters, but also every components can be flexible to replaced or tailored.
4. Prerequisite and Limitation
Currently, Ease Monitor only supports
- Java Language Service, and the version need be >= 1.6
- Linux Operation System
5. Features Showcase
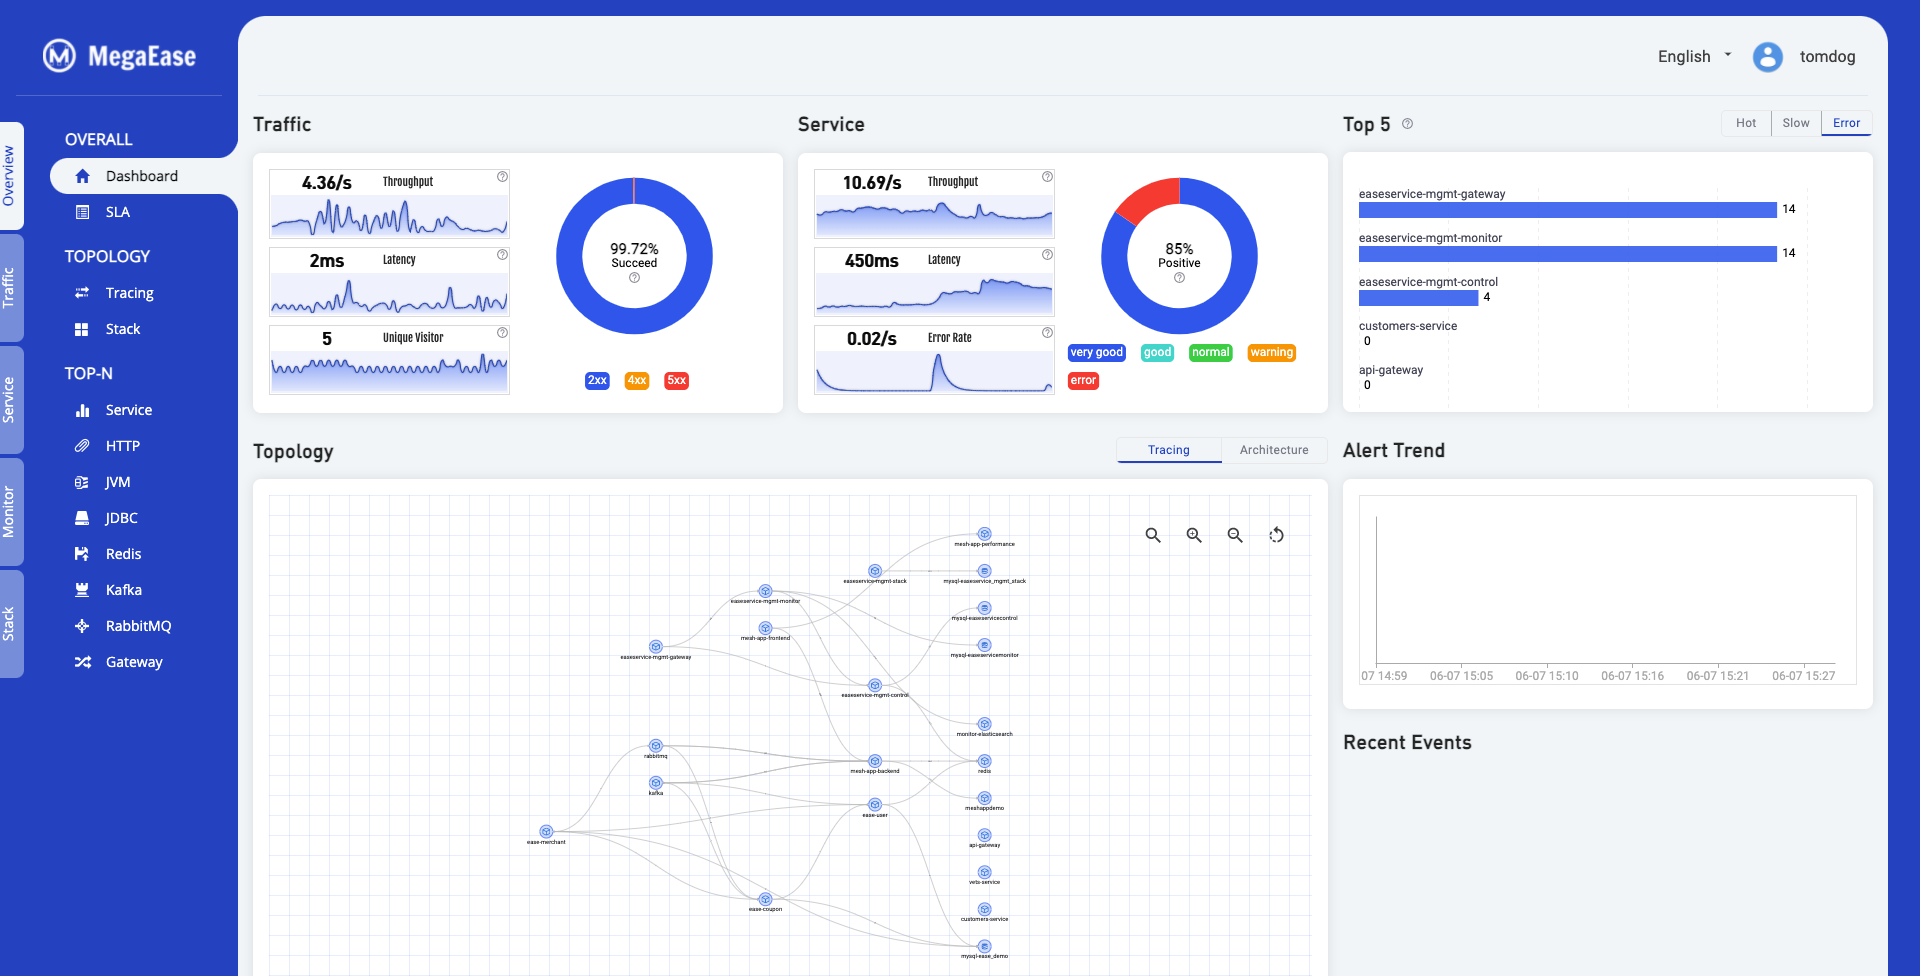
5.1 Overview Dashboard
The Overview dashboard shows the overall health and capacity.
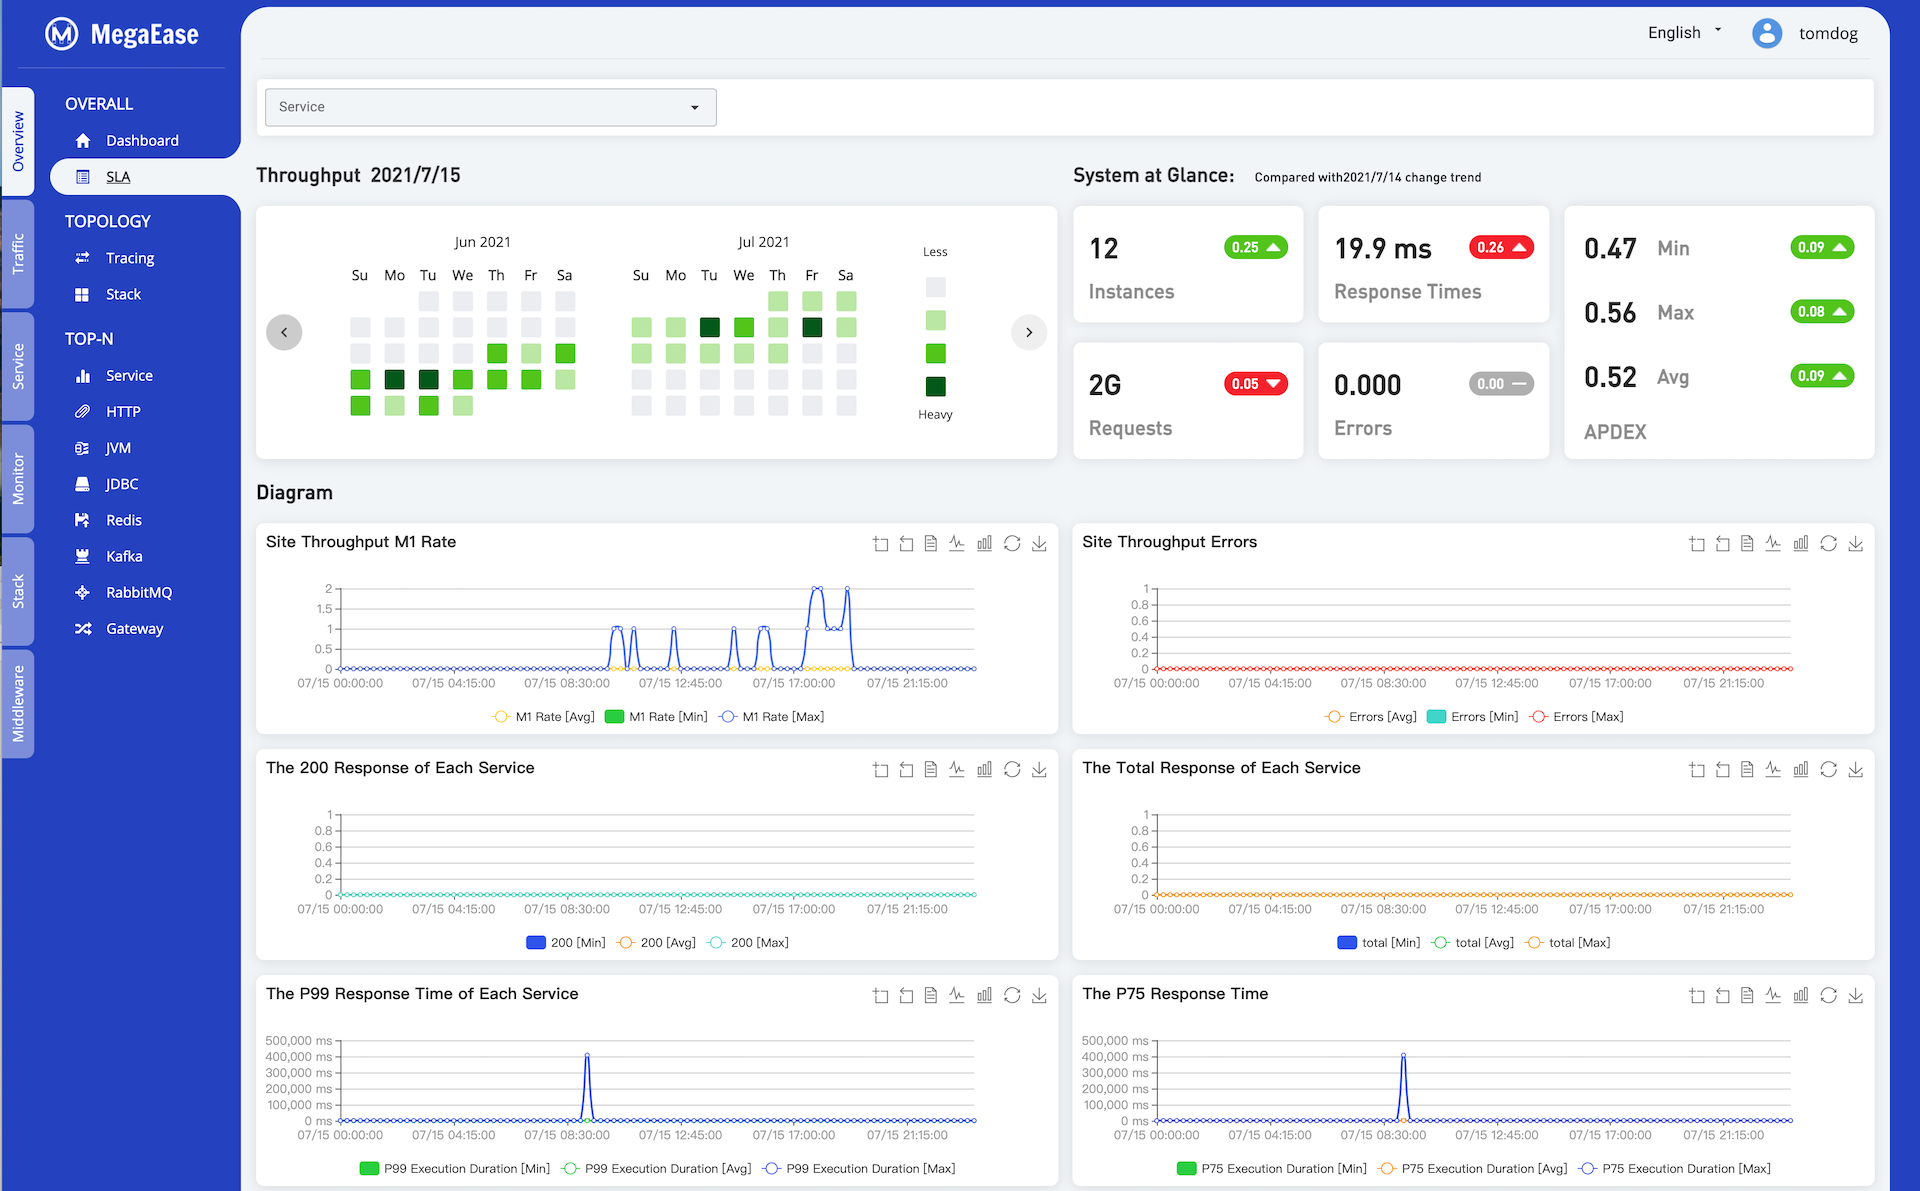
5.2 Service SLA Daily Report
The following diagram shows the daily SLA report, it could be the whole site or individual service.
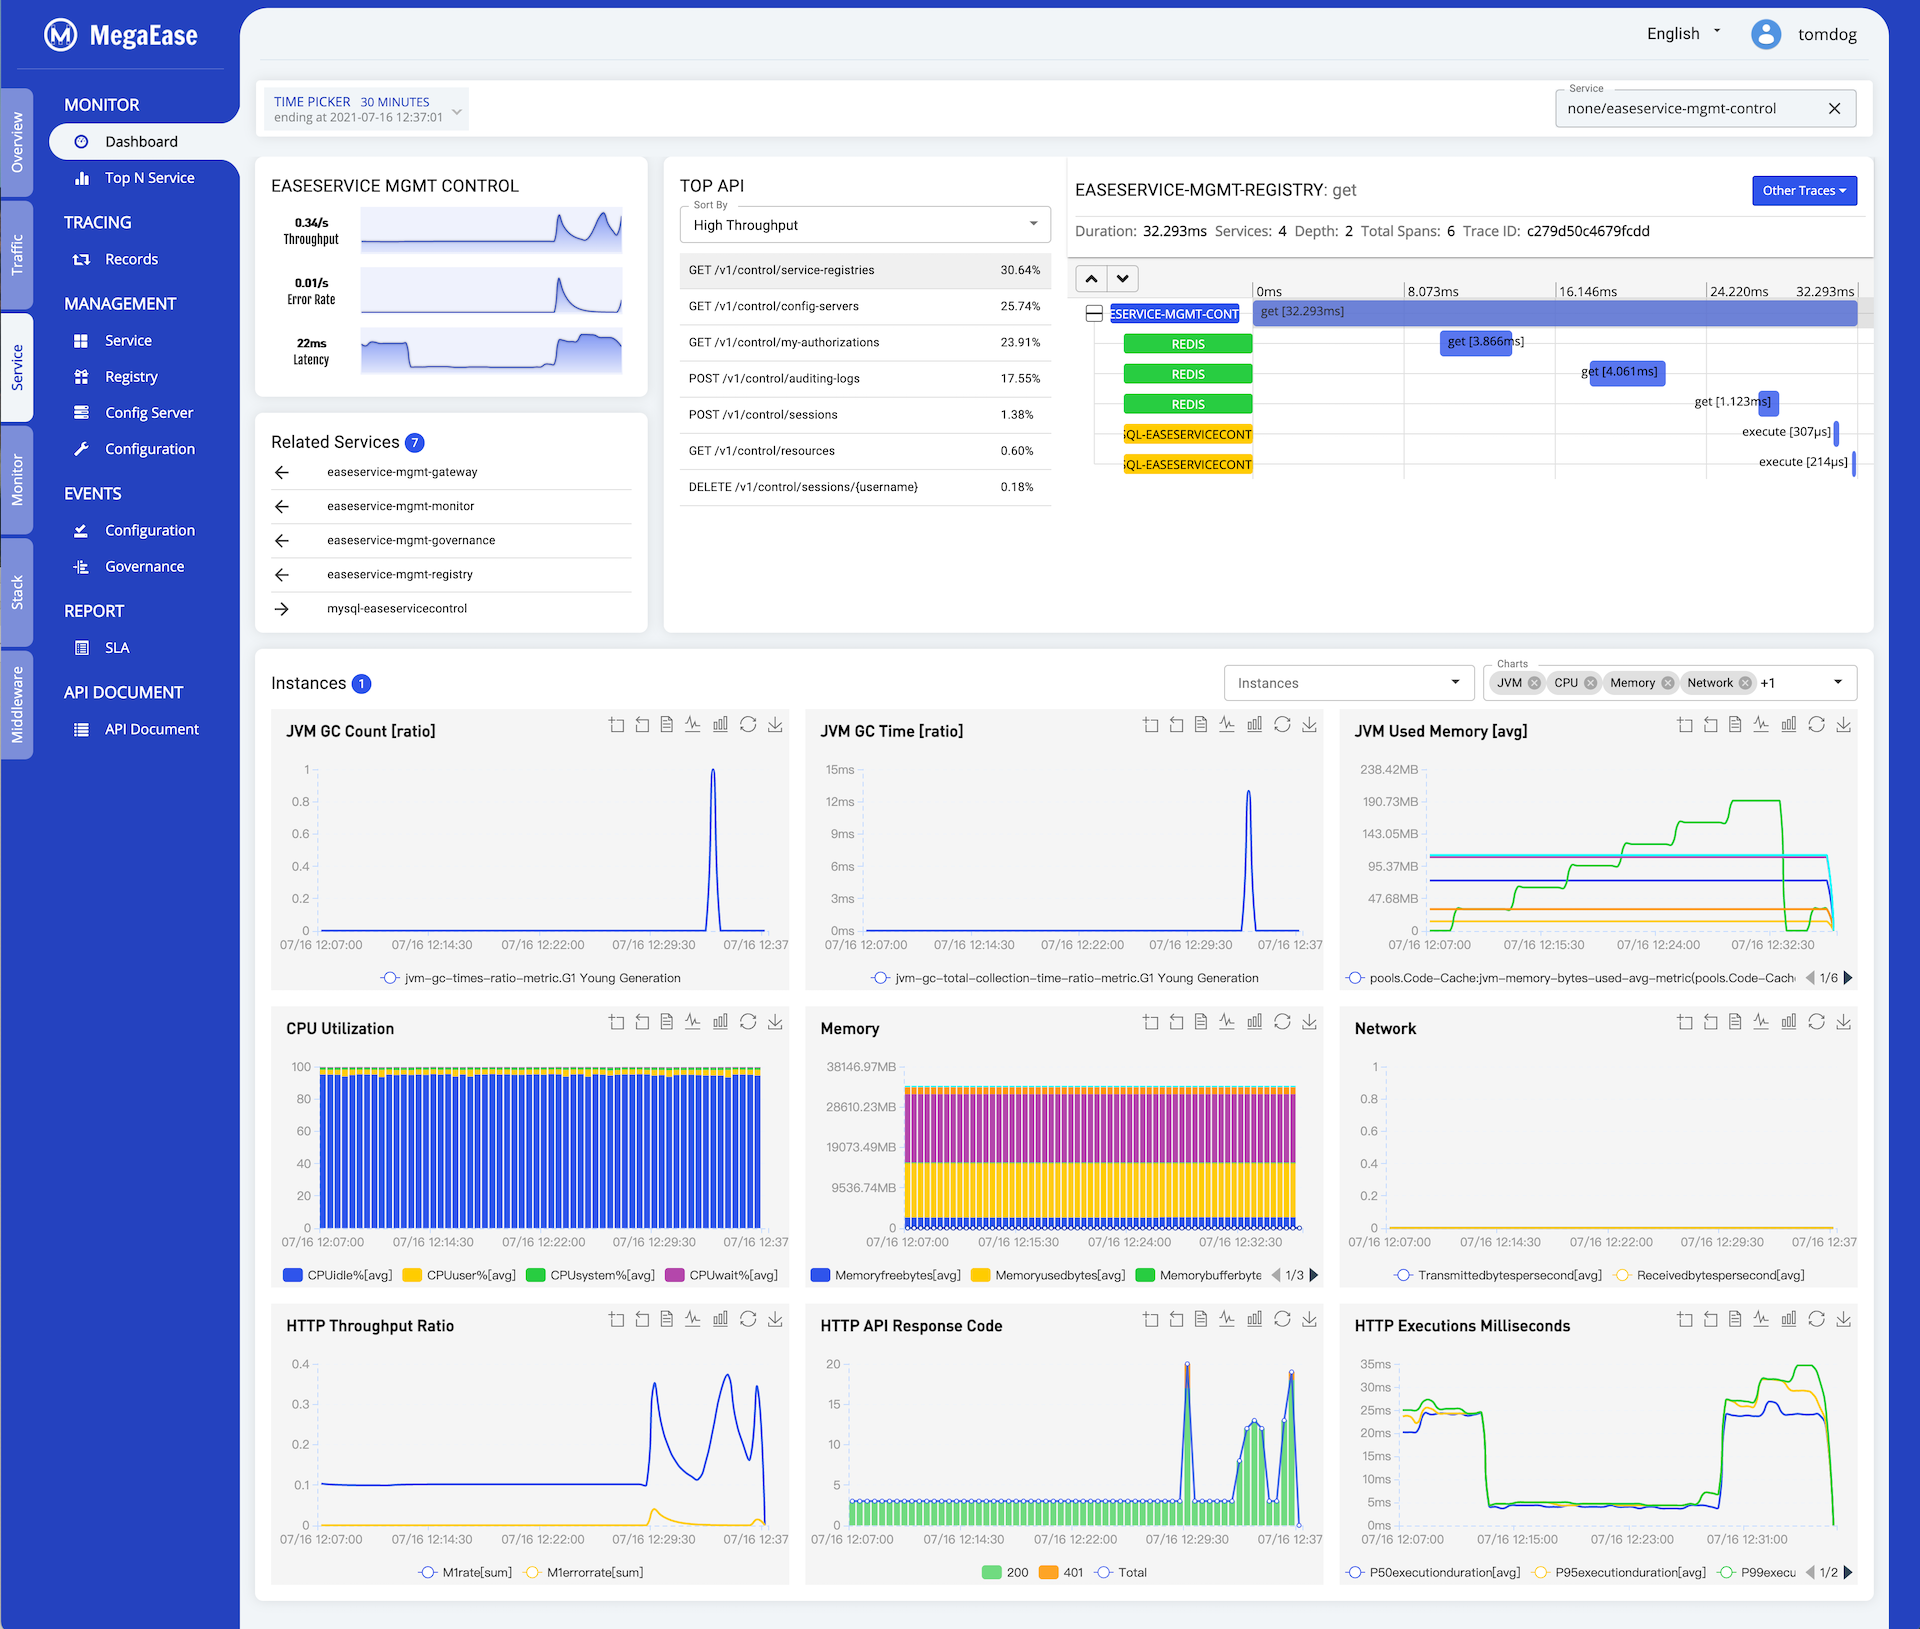
5.3 Service Dashboard
The following Service Dashboard put the service traffic, the upstream and downstream services, TOP API,Top 5 slowest tracing request,and the related the resource and the metrics.
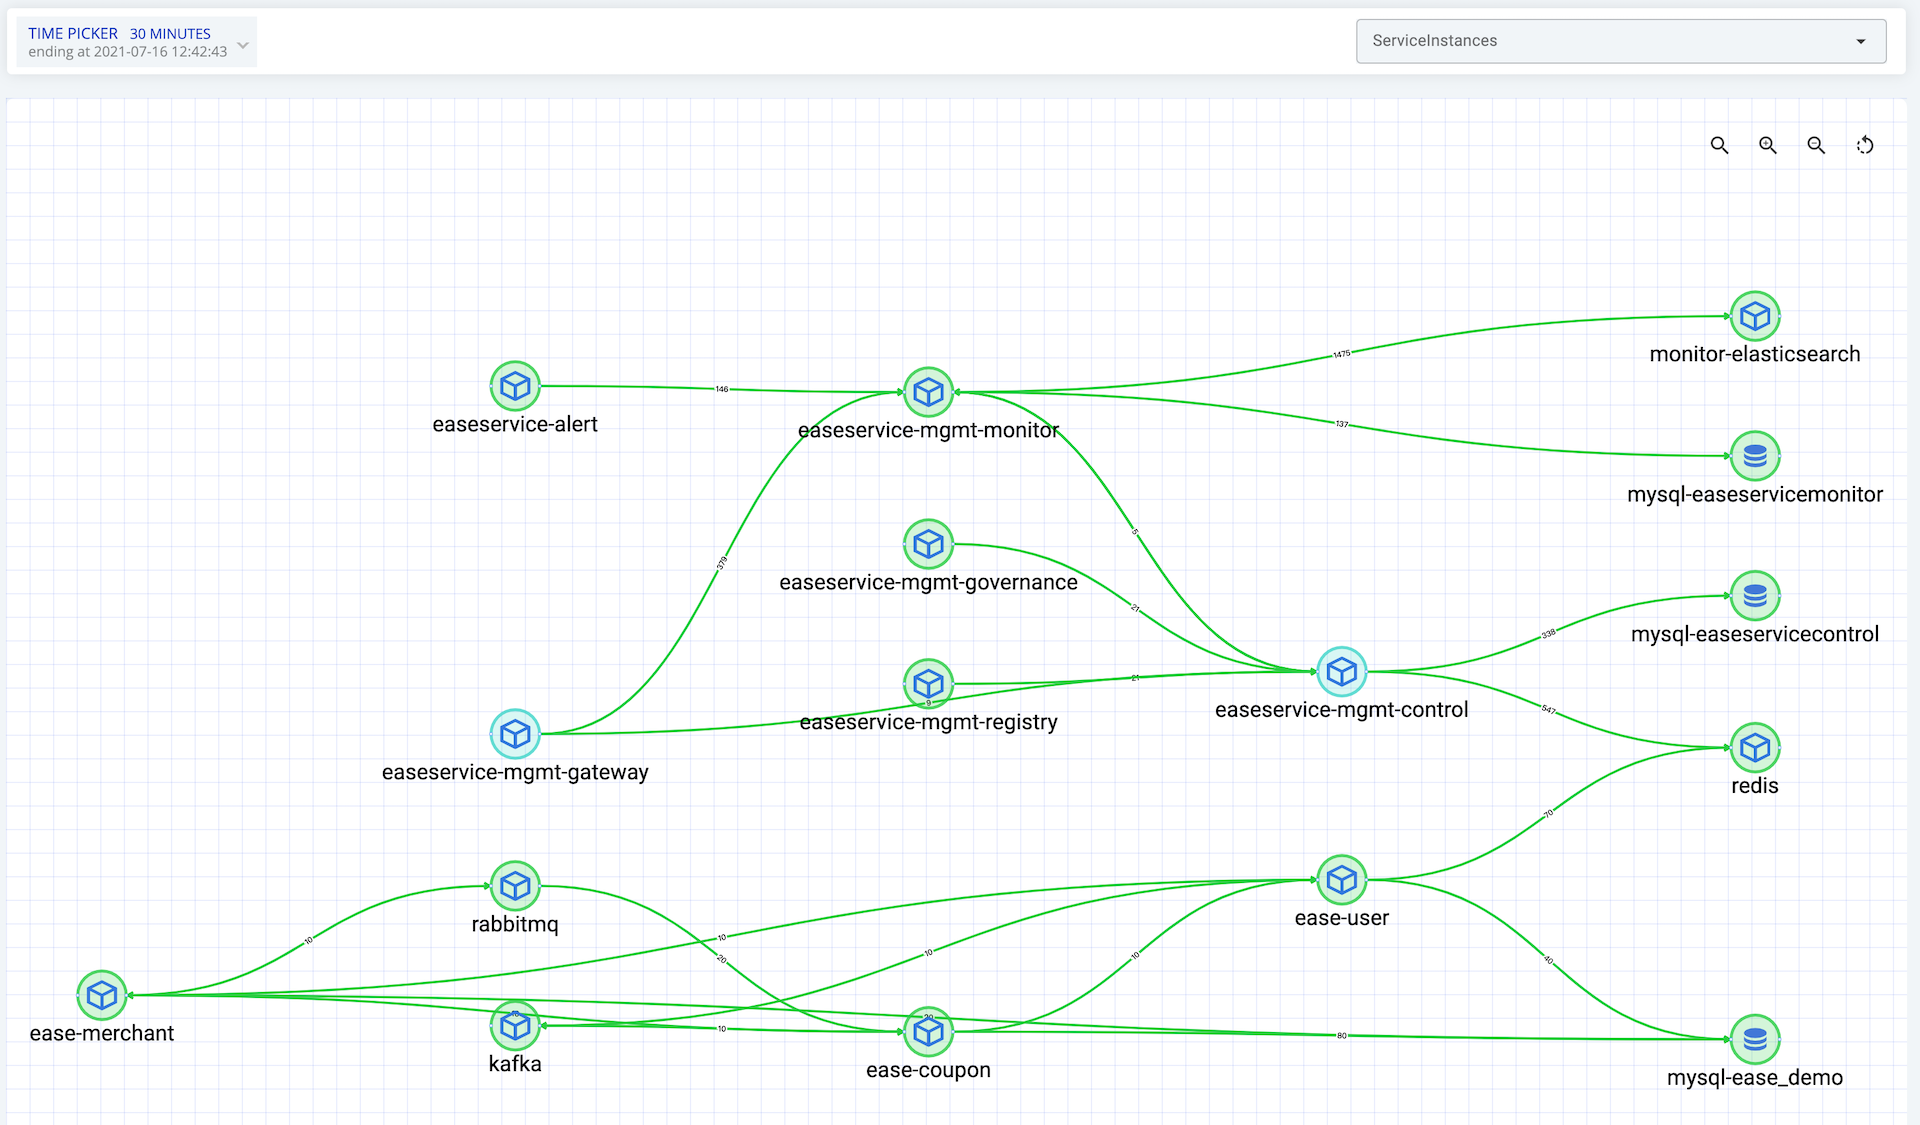
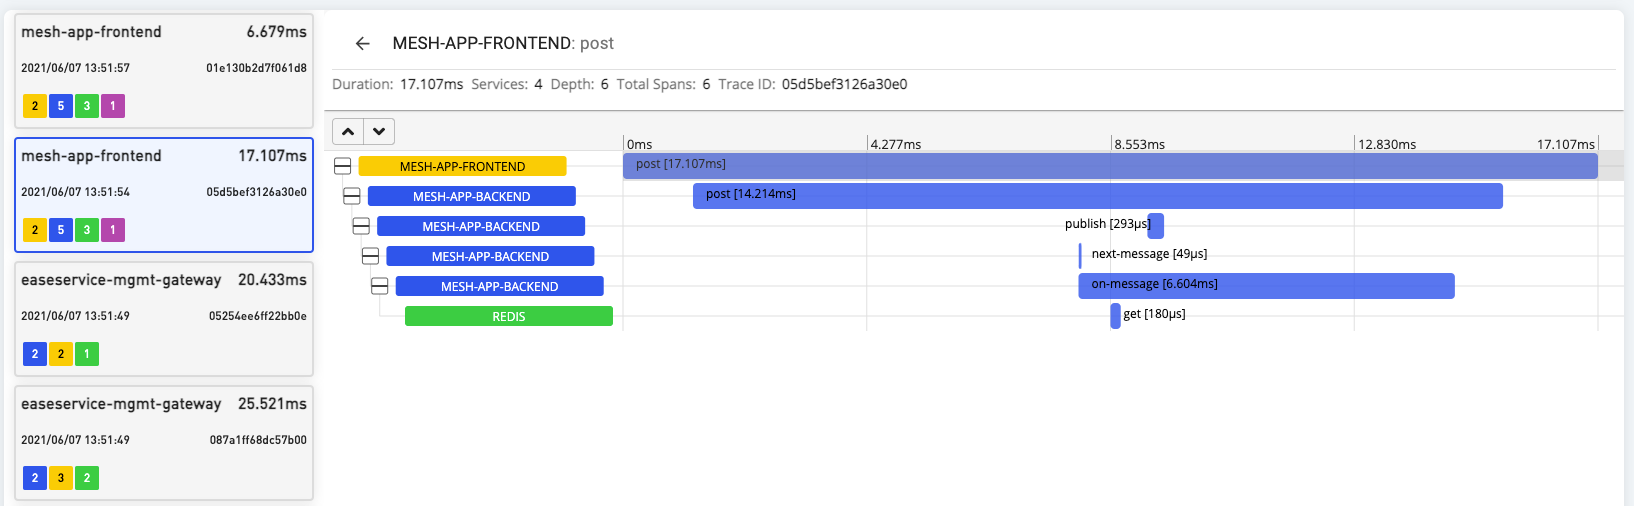
5.4 Tracing
The real-time topology could let us understand the architecture of the services.
The Tracing could let us understand the chains of the services call and its performance.
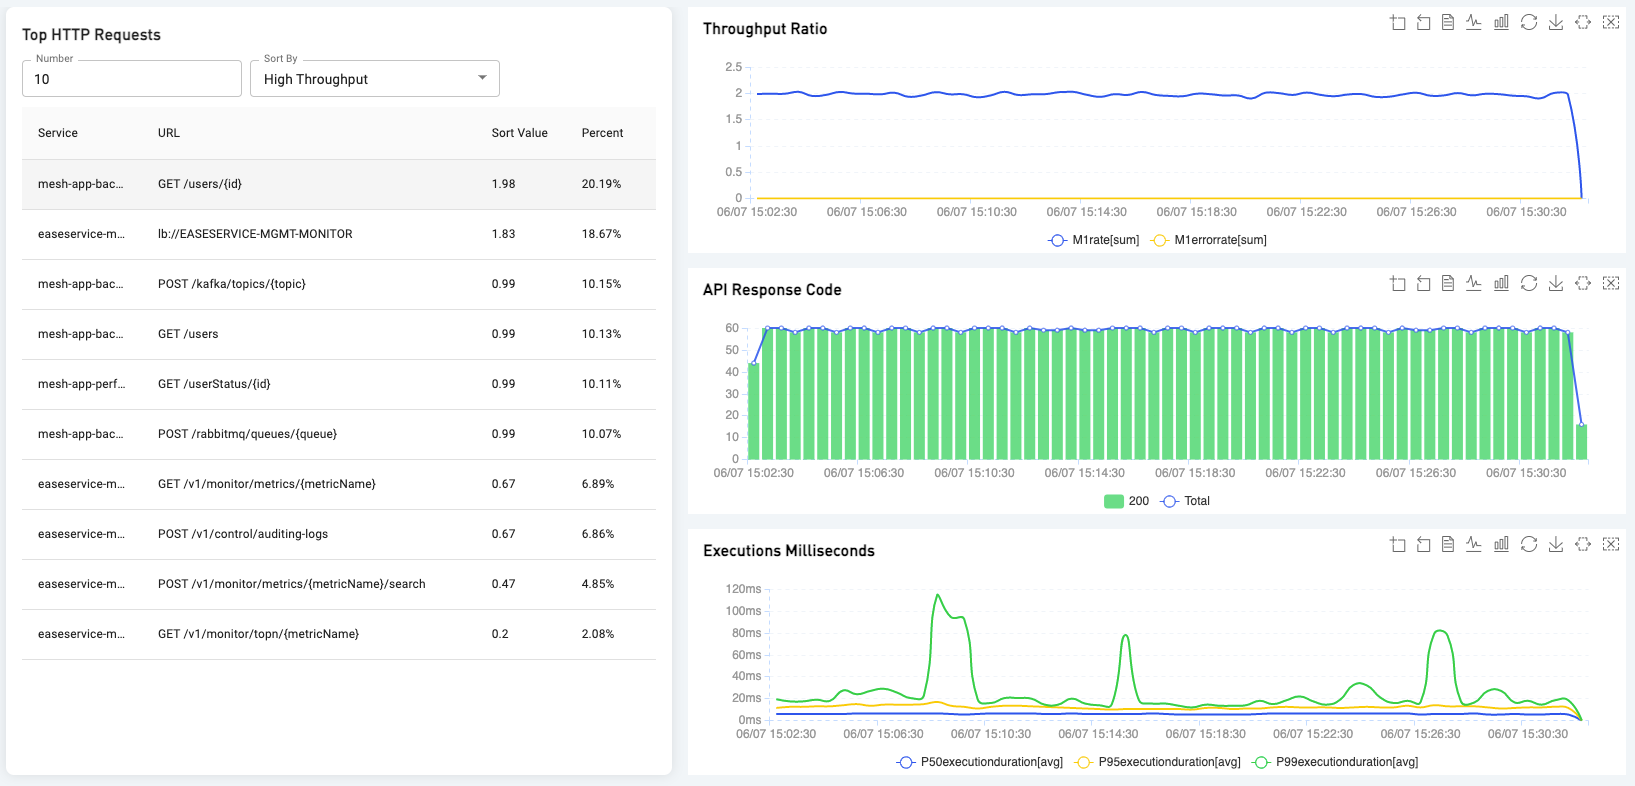
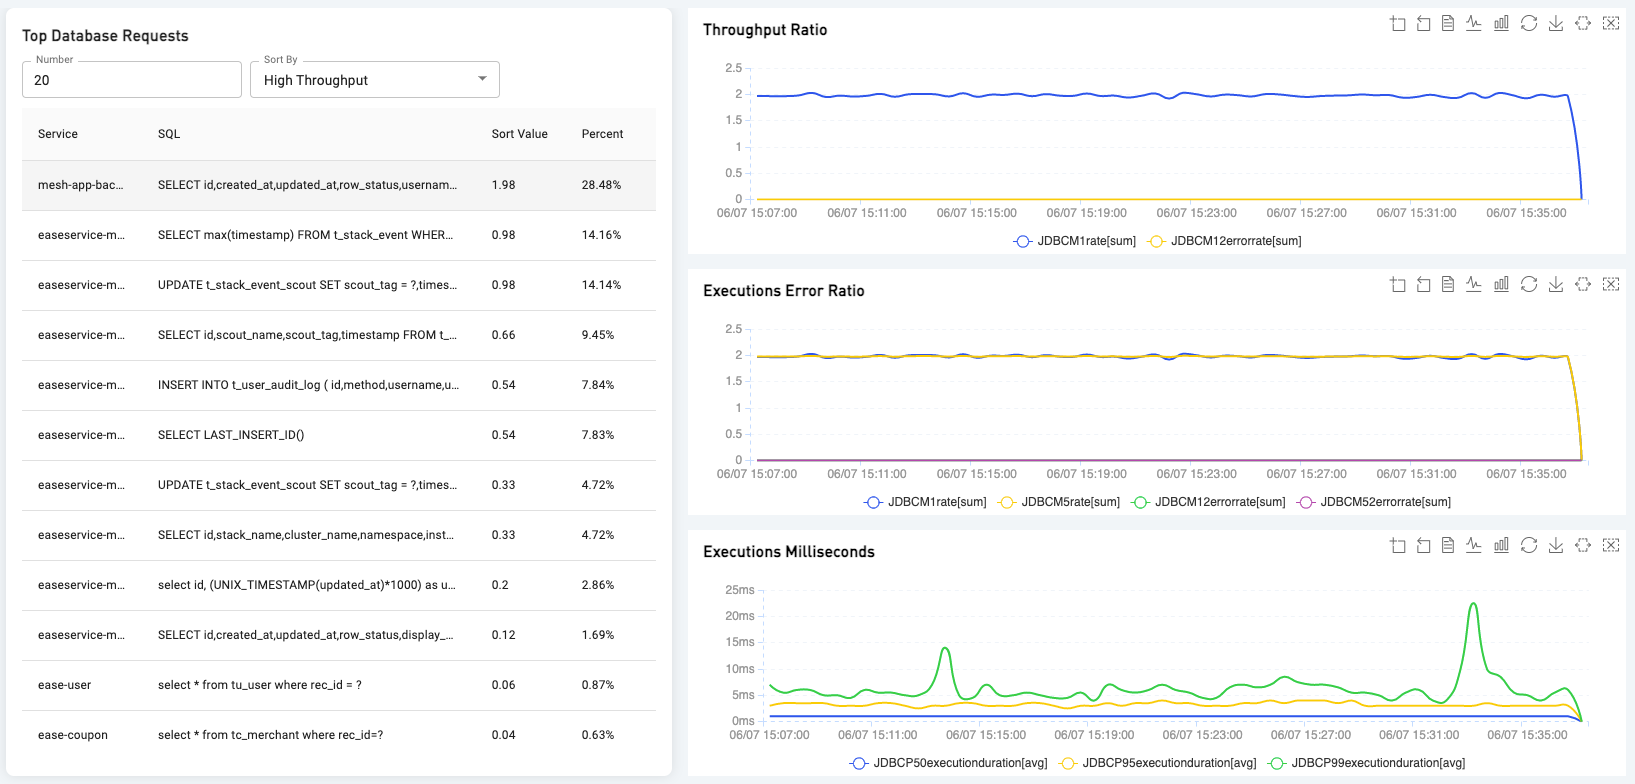
5.5 Top N List
Top N lists show the operations or APIs consumed the time most.
Service Top API List
JDBC Top Operation List
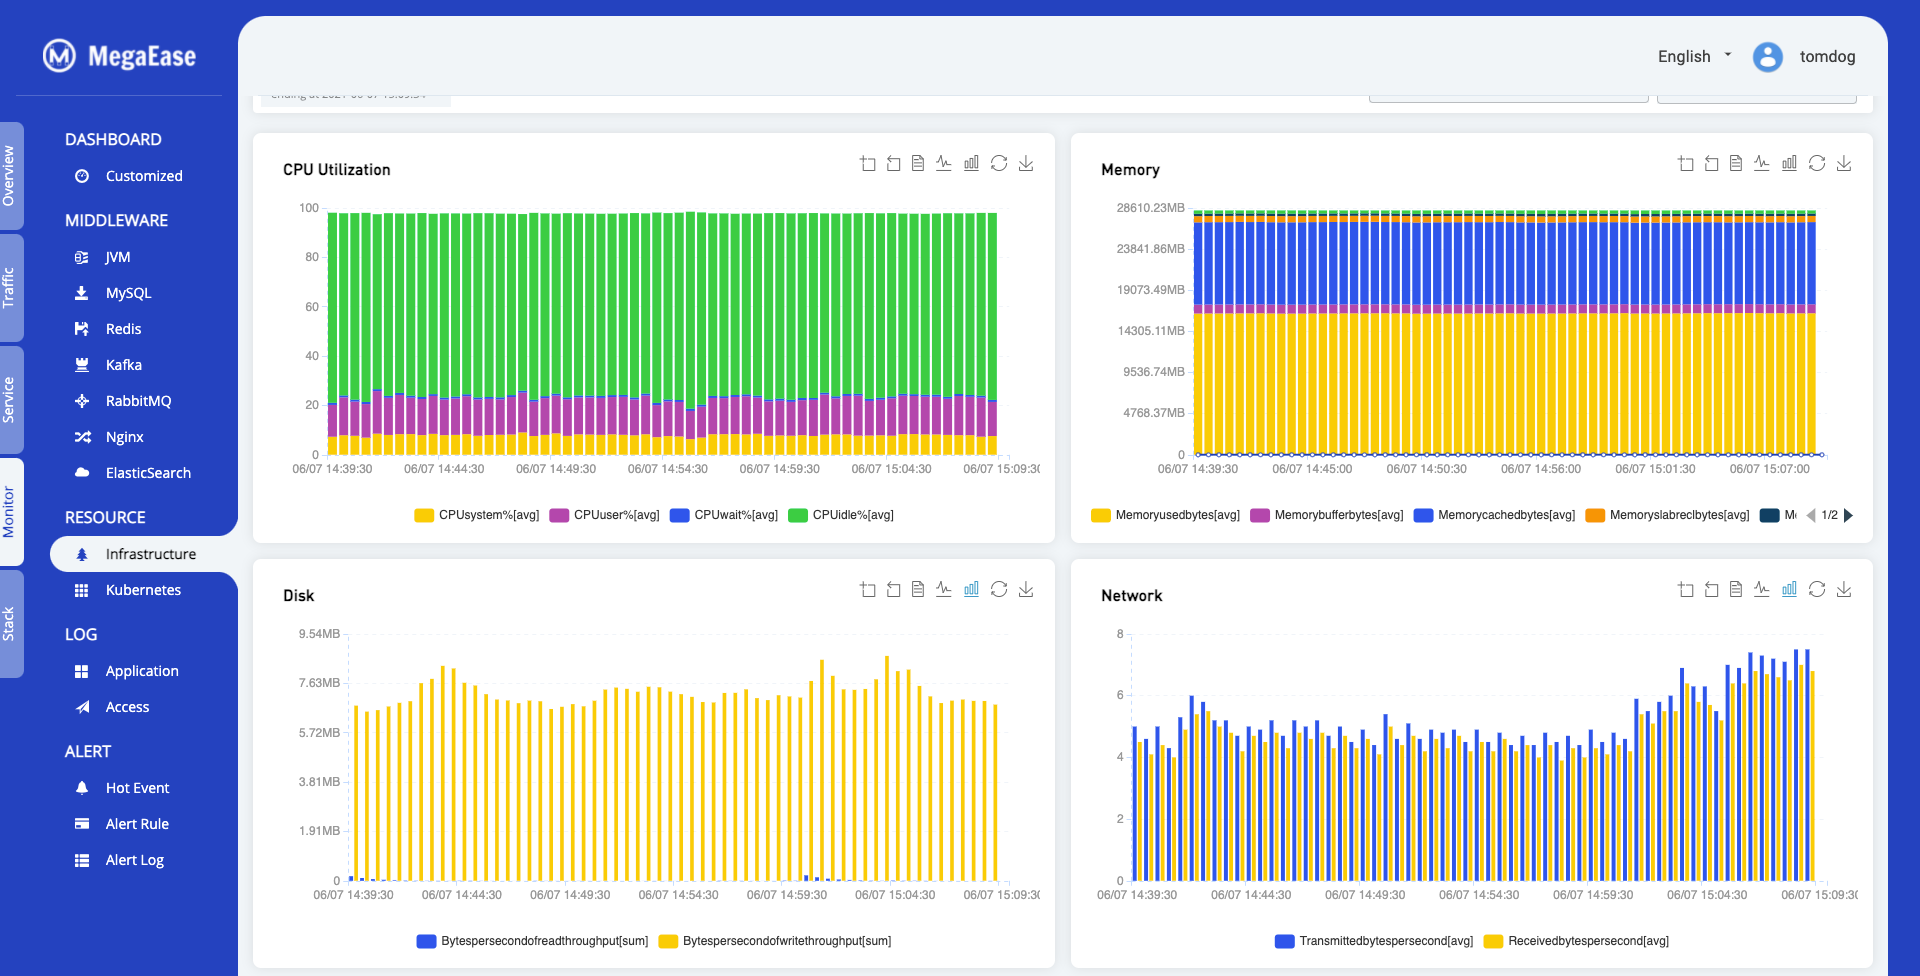
5.6 Customized Dashboard
The customized dashboard.
Infrastructure Dashboard
6. Technical Details
6.1 EaseAgent
- EaseAgent is a Java agent for APM(Application Performance Management) system.
- EaseAgent majorly focuses on the Spring Boot development environments.
- EaseAgent is compatible with mainstream monitoring ecosystems, such as Kafka, ElasticSearch, Prometheus, Zipkin, etc.
- EaseAgent collects the basic metrics and the service tracking logs, which is very helpful for performance analysis and troubleshooting.
6.1.1 Design Principles
- Design for Micro-Service architecture, collecting the data from a service perspective.
- Instrumenting a Java application in a non-intrusive way.
- Lightweight and very low CPU, memory, and I/O resource usage.
- Safe to Java application/service.
6.1.2 Compatibility and Requirement
- Collecting Metric & Tracing Logs.
JDBC 4.0HTTP Servlet、HTTP FilterSpring Boot 2.2.x:WebClient、RestTemplate、FeignClientRabbitMQ Client 5.x、Kafka Client 2.4.xJedis 3.5.x、Lettuce 5.3.x
- Collecting Access Logs.
HTTP Servlet、HTTP FilterSpring Cloud Gateway
- Instrumenting the
traceIdandspanIdautomatically - Supplying the
health checkendpoint - Supplying the
readiness checkendpoint forSpringBoot2.2.x
6.1.3 Data Collection
- HTTP Requests Metrics.
- JDBC
ConnectionandStatementMetrics, and related context information (such as, URL, SQL statement, etc.) - Compatible
Zipkinprotocol to trace the distributed services. which includes:- HTTP receive and send
- SQL execution
- Redis access
6.1.4 Usage
Downloads easeagent.jar from release , and just simply add the follow arguments for Java application running:
-javaagent=easeagent.jar
6.2 Event
Currently, the Ease Monitor event handling would deal with the following cases.
Metric - Duration - Threshold. A metric keeps exceeding the threshold in certain duration. (e.g. cpu > 80% lasts 2mins)
Metric - Duration - Percentile - Threshold. A metric’s percentile(e.g. P99) exceed the threshold in certain duration. (e.g. response time P90 > 300ms lasts 2mins)
Metric - Duration - Function - Threshold. Support some simple functions - Sum/Average/Min/Max/Count to trigger the event.
Logs - Duration - Keywords - Times. Monitor a certain keyword(support the regular expression), if the keyword matched the configured times, then report the event.
6.3 Data Store Schema
The following data schema is used for ElasticSearch storing.
6.3.1 Indices Schema
| Index mapping template | Index pattern | Description |
|---|---|---|
| ease-monitor-metrics-* | ease-monitor-metrics-YYYY.MM.DD | Saves time series based metrics of monitored object from different categories. The metrics from different monitored object will be saved into a dedicated document type. |
| ease-monitor-aggregate-metrics-* | ease-monitor-aggregate-metrics-YYYY.MM.DD | Saves calculated performance statistics from different dimensions monitoring requirement needed. The statistics from different dimensions will be saved into a dedicated document type. Due to the statistic calculation are executed on these input metrics directly as streaming and the results will be saved into this index in advance, so the statistics can be loaded and used without any further aggregation(e.g. grouping and computing). This will definitely help the performance of ad-hoc query on the fine-grained metrics ES stored, especially on a large metrics data volume. This index was designed only to save these statistics ones can be calculated by a simple (fast) and fixed (can be implemented on product design stage instead of runtime stage) functions. |
| ease-monitor-logs-* | ease-monitor-logs-YYYY.MM.DD | Saves the logs outputted from OS, middleware and application. The different logs will be saved into a dedicated document type. |
6.3.2 Document Types Schema
The Document Types Schema include the following things:
Index mapping template
ease-monitor-metrics-*- for metrics dataease-monitor-aggregate-metrics-*- for java agent metrics dataease-monitor-logs-*- for logs
Category
application- for Java Agent metrics data.platform- for a number of middleware metrics - such as:nginx,redis,tomcat,mysql,kafka… etc.infrastructure- forCPU,MEM,DISK,NETmetrics.
Document Type
- The name of the component.
- The group of the performance counters and statistics.
For example:
| Index mapping template | Category | Document type | Description |
|---|---|---|---|
| ease-monitor-metrics-* | application | http_request | Saves application HTTP request records, which contains URL address and parameters, execution duration, response code and other useful fields. |
| platform | jvm_memory | Saves JVM performance counters and statistics for heap, non-heap and each spaces. | |
| jvm_gc | Saves JVM performance counters and statistics for garbage collector. | ||
| tomcat_global | Saves the performance counters and statistics of global request processor and thread pool. | ||
| tomcat_cache | Saves the performance counters and statistics of each context cache. | ||
| tomcat_servlet | Saves the performance counters and statistics of each servlet. | ||
| nginx | Saves nginx performance counters and statistics. | ||
| mysql | Saves mysql performance counters and statistics. | ||
| redis_server | Saves redis server performance counters and statistics. | ||
| redis_keyspace | Saves redis key space performance counters and statistics. | ||
| infrastructure | cpu | Saves the percentage utilization of special logic core. | |
| memory | Saves the percentage utilization and capacity in bytes. | ||
| interface | Saves the performance counters and statistics for each interface separately (without ’lo’ loop device), e.g. tx and rx bytes. | ||
| disk | Saves the performance counters and statistics for each block device separately, e.g. iops, mbps. (busy percentage indicator will be added in future). | ||
| df | Saves the utilization counters for each block device | ||
| ease-monitor-aggregate-metrics-* | application | http_request | Saves the calculated values of separated and total executions per second in every 1, 5, 15 minutes. The request count will be saved as well. |
| jdbc_statement | Saves the calculated values of separated and total executions per second in every 1, 5, 15 minutes. And also saves minimal, mean, maximal and 25%, 50%, 75%, 95%, 98%, 99%, 99.9% user’s execution duration. The execution count will be saved as well. | ||
| jdbc_connection | Saves the calculated values of database connection establishment per second in every 1, 5, 15 minutes range. And also saves minimal, mean , maximal and 25%, 50%, 75%, 95%, 98%, 99%, 99.9% user’s connection establishment duration. The establishment count will be saved as well. | ||
| ease-monitor-logs-* | application | <component-name> | Saves log records collected from application’s component. |
| platform | tomcat_exception | Saves the exception messages of the stack. | |
| nginx_access | Saves HTTP access records from nginx access log. | ||
| nginx_error | Saves error records from nginx error log. | ||
| mysql_slow_sql | Saves slow SQL records from MySQL log. | ||
| infrastructure | os_syslog | Saves log records from OS ‘syslog’ file. | |
| os_dmesg | Saves log records from OS ‘dmesg’ file. |